Import / Export#
[1]:
%matplotlib inline
%config InlineBackend.figure_format='retina'

# use '%matplotlib widget' for interactive plot

import sys
import matplotlib.pyplot as plt

from zeroheliumkit import GeomCollection, SpiralInductor
from zeroheliumkit.src.settings import *
from zeroheliumkit.src.importing import Reader_DXF, Reader_GDS, Reader_Pickle
[2]:
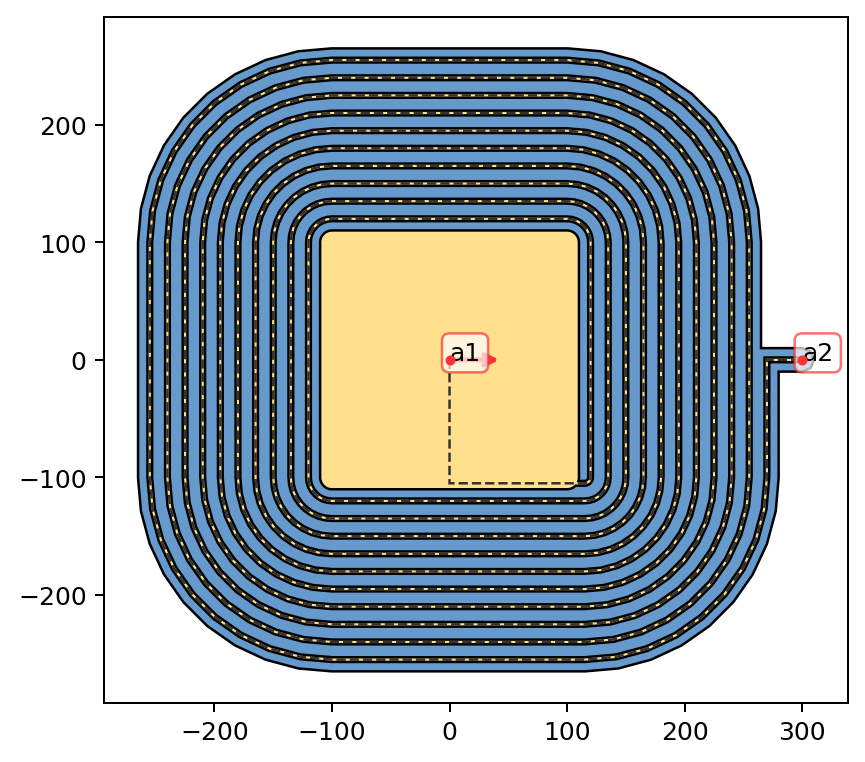
# creating test zhk structure
t = SpiralInductor(size=200,
                   width=10,
                   gap=5,
                   num_turns=10,
                   smallest_section_length=0.1,
                   layers={"metal": 4, "diel": 20},
                   alabel=("a1", "a2"))

plot_cfg = {"diel": BLUE, "metal": YELLOW2, "anchors": RED}
t.quickplot(color_config=plot_cfg, size="medium")
[2]:
<Axes: >

[3]:
### testing exporting and importing
[5]:
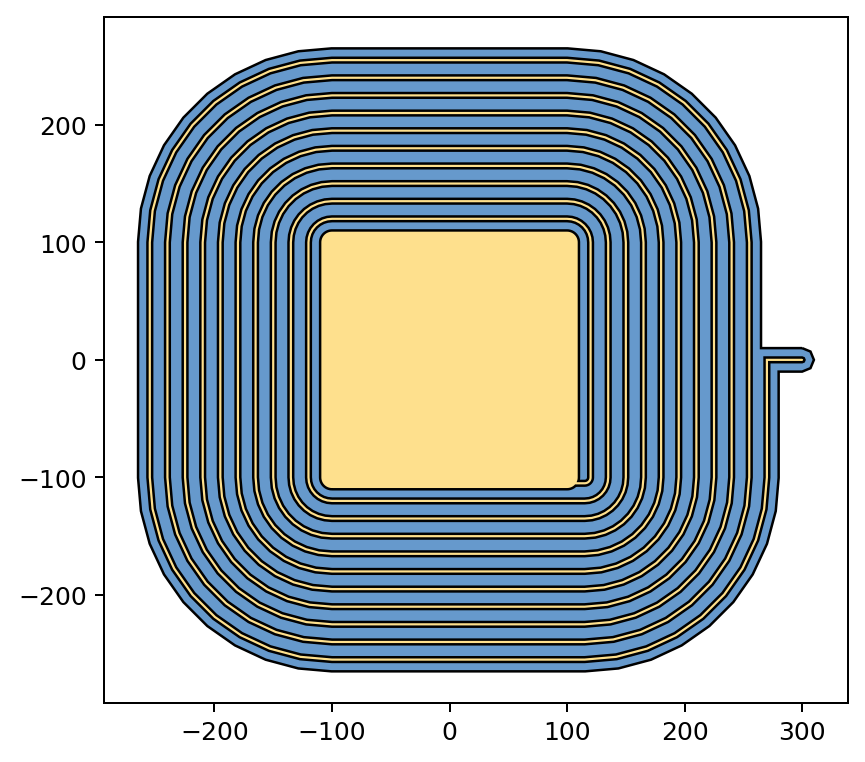
# save to gds
layer_cfg = {"diel": {"layer": 1, "datatype": 0},
             "metal": {"layer": 2, "datatype": 0}}
t.export_gds("test", layer_cfg)

# now we import created file

gds = Reader_GDS("test.gds")
t1 = GeomCollection(gds.geometries)
plot_cfg = {"L1": BLUE, "L2": YELLOW2, "anchors": RED}
t1.quickplot(color_config=plot_cfg, size="medium")
Geometries saved successfully.
test.gds // Layers in cell 'toplevel': [1, 2]
[5]:
<Axes: >

[7]:
# save to dxf
layer_cfg = {"diel": {"layer": 1, "datatype": 0},
             "metal": {"layer": 2, "datatype": 0}}
t.export_dxf("test", ["diel", "metal"])

# now we import created file

gds = Reader_DXF("test.dxf")
t2 = GeomCollection(gds.geometries)
plot_cfg = {"diel": BLUE, "metal": YELLOW2, "anchors": RED}
t2.quickplot(color_config=plot_cfg, size="medium")
Geometries saved successfully.
test.dxf // Layers : dict_keys(['diel', 'metal'])
[7]:
<Axes: >
[8]:
# save to pickle
t.export_pickle("test")

# now we import created file

gds = Reader_Pickle("test.pickle")
t3 = GeomCollection(gds.geometries)
plot_cfg = {"diel": BLUE, "metal": YELLOW2, "anchors": RED}
t3.quickplot(color_config=plot_cfg, size="medium")
Geometries saved successfully.
[8]:
<Axes: >